Most chemical, and water level outputs that are required are available under the 'Toggle Labels' button on the map toolbar. However, users can create their own outputs if required.
The following example covers the major concepts: summarising data to obtain a single data row (record) to be used at each location, and; customising the map properties.
Using the following data we want to display the depth range of Fill at each point on the map:
 (Fig 1)
For BH01 we can see the following characteristics of the data. There are multiple entries for BH01, and Fill is present in two of them. We want to summarise the data so that it looks like the following: (ie filtered for Fill, showing the min and max depths at which Fill is present. One line of data for each point also ensures that your data can be correctly mapped at each point)
 (Fig 2)
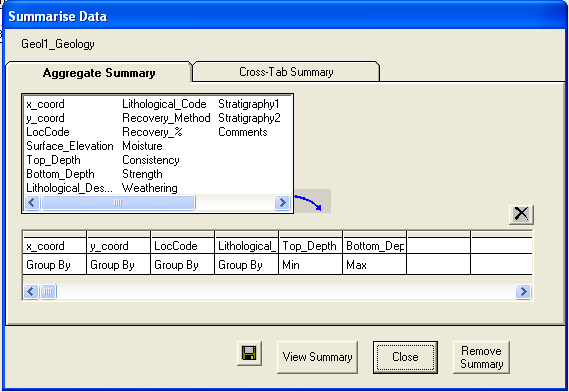
To achieve this summary of the data we use the 'Summarise Data' button ( ![]() on the left toolbar next to the data) and generate the summary as follows:
on the left toolbar next to the data) and generate the summary as follows:
 (Fig 3)
(more info on the summary is in the tutorials if required, note that the co-ordinates need to be included so that the data can be mapped)
Once you have clicked 'View Summary' and 'Close' you may have to filter for 'Fill' to remove the other Lithology_Codes and to see the data as shown in Figure 2.
(Note if you are going to be re-using this you can save this summary using the button on this form; give it a name starting with Geol (case sensitive) and it will appear under the same data-type button as the other geology data. If you have done this, close the form and select this new View from the Geology datatype button)
Once you can see the data as shown in Fig 2 you can open the map. If you toggle through the 'Toggle Labels' options on the map you will have one option that gives the 'Min(Top_Depth)'. To get a label showing "Min(Top_Depth) - Max(Bottom_Depth)" we need to customise the label.
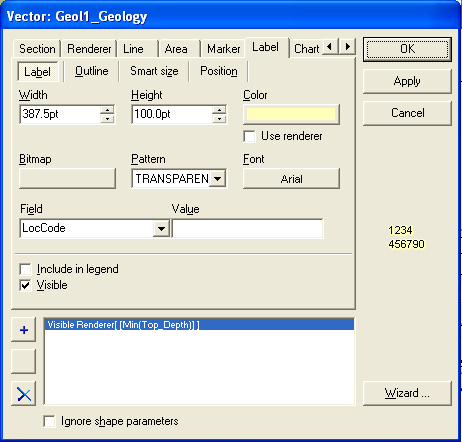
Click the ‘View and Manage map layers’ button at the right end of the map toolbar. The layers shown on the map will be visible on the right. Double click the layer showing your points. Select the 'Label' tab as shown below.
The 'Field' value shows the current label settings. You can select any field you wish from this drop-down. To display multiple fields however is a little more complicated. The following text typed or pasted into the 'Field' drop-down will give us the label we want
:<:Min(Top_Depth)>-<:Max(Bottom_Depth)>
The generalisation of the format is :<:Field1><:Field2> etc.. Any additional characters (Such as a "-") can be inserted between the fields.

If you click apply you will be able to see the data you are looking for. You can play around with the other map settings to change other aspects of the appearance.
If you want ‘Range of Gravel’ and if there are two separate intervals of gravel separated by some clay (ie an upper and a lower sequence) you will want each shown separately. In this case you should assign values to and use the Stratigraphy columns rather than the lithology_code column to differentiate them and create a different summary based on this.