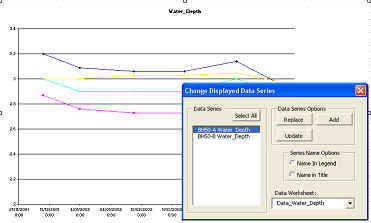
Charts produced through ESdat use the Excel charting capabilities, and are fully customisable within the capabilities of Excel.
Users have option of using the "Generic" graphing tool, or the "Chemistry Specific" tool for time series chemical data, or the "Geochemistry" tool for geochemical work. This page describes the "Generic" graphing tool.
If you click the chart button the data will be charted using the system defaults, however if you click the drop-down arrow to the right of the button the following dialogue box will appear.
|
The contents of this form will depend on what you are plotting. The options available include:
Trend Analysis Tab - This provides a trend analysis of the data, and shows the results on the chart. The Mann-Kendal tool is also available when using the "Chemistry Specific" graph tool.
List All Options - will show all possible options (as shown). Initially only the defaults are shown.
Invert - used if numbers should be increasing down the y-axis. Useful if the y-axis is a depth (eg water level depth) rather than an elevation or a measure (such as a concentration or a count).
Log Scale - The resultant chart will use a log scale on the Y-Axis
Check for Duplicate Chart Values - you may select your settings so that there are two or more values for a series at a particular x axis value (ie two water levels, concentrations, or counts for a particular location on a particular date). You can either modify your settings so that multiple values are plotted as different series, otherwise the maximum value will be shown.
New Chart for changes in: - this allows multiple charts to be quickly produced, one chart for each unique value of a particular field or combination of fields. In the example shown there will be a different chart for each monitoring unit (which usually equates to each aquifer)
Consistent X/Y-axis - It is often desirable to use a consistent x and/or y axis to compare data.
Chart Updateable - Charts can be automatically updateable, having a link to the database so they can be updated without having to be regenerated.
Chart Template - Various templates can be set up with desired settings, logo's, etc.. More information is available under "Templates". It is also possible to add the data to charts that are already open in Excel; meaning you can export one kind of data (such as water levels) then export another kind of data (such as rainfall or stream flows) to the same graph. You will also have the option of specifying the colour and style of additional exports. |
Once the chart has been plotted the contents can be changed by clicking the ![]() button at the bottom right corner of the chart (or under tha Add-Ins tab in Excel 07)
button at the bottom right corner of the chart (or under tha Add-Ins tab in Excel 07)
