Dust Deposition data refers to data that is collected within a collection tray of a specified area over a indeterminate number of days. The dust sample is sent off to the laboratory and the results are returned in terms of mg/sample or ug/sample or similar (ie Total Solids = 41 mg). On receiving the data the results are corrected for the sampling area, and the duration and are normally reported as mg/m2/30 days or similar.
ESdat (with SQL Server Upgrade, only) can store field and lab Dust Deposition data.
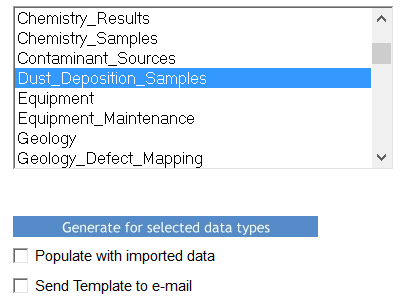
Information on the Dust Deposition Sampling is imported into the "Dust Deposition_Samples" table. This table supplements the "Chemistry_Samples" table, providing information specific to Dust Deposition Sampling. The import template is generated as shown below.

The “Dust Deposition Samples” Import Template will be shown as follows and can be populated:

| • | Field_ID: Must match the Samples Field ID as sent to the lab for analysis. |
| • | Start/End_Date: The Date (and time) when sampling started/ended. |
| • | Capture Area: The Area of sampling in the Area Units. |
| • | Area Units: the measurement units, in one dimension (ie m rather than m2) |
| • | Days to be corrected to: The sampling duration (End Date minus Start Date) can be extrapolated to a specific required duration, thus allowing standardisation of duration in the results. |
| • | Other Sampling Fields: Other sampling fields (such as Location, Sampled By) are captured in the generic sampling fields, and are typically specified when importing the lab data. |
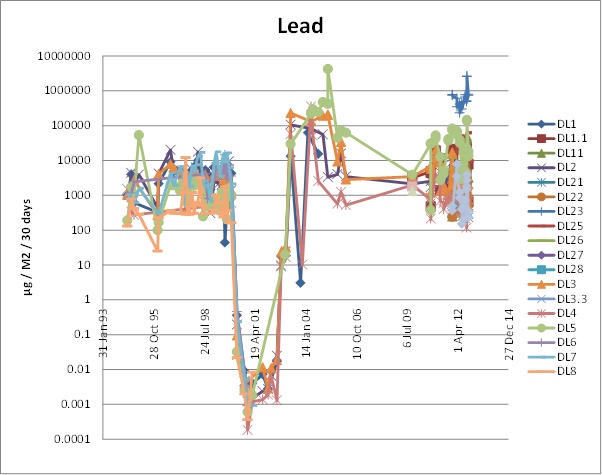
| • | Outputs are corrected for Sample Area and Duration. Typical outputs include Exceedance Tables and graphs: |
Laboratory data is imported in the normal manner, but the Matrix Type will need to be set to a value such as "Dust", which will need to have a Matrix State (see zRef_Matrix_Types) of "DustDep". The Field ID values will need to be matched.
If receiving dust results reported in ug/m3 the Matrix Type should have a Matrix State of “Gas” (see zRef_Matrix_Types).
Outputs are as per normal outputs (ie tables and graphs), for example below:
